윈도우 도커를 이용하여 프로메테우스와 그라파나를 설치해보겠습니다.
node_exporter는 사용하지 않고 client_golang/prometheus 라이브러리를 통해 custom node exporter를 사용했습니다.
필요하신분은 node_exporter를 도커설치하시면 됩니다. 댓글에 궁금하신 사항 남겨주시면 알려드릴게요
들어가기전 필자는 "C:\workspace\Docker\volume\prometheus" 해당 폴더를 ""작업폴더""로 지칭하겠습니다.
1. (Docker) Prometheus와 연결할 Windows Volume 만들기
공유하고자하는 볼륨디렉토리에 들어가서 아래와 같이 디렉토리를 만듭니다.
# 필자는 "C:\workspace\Docker\volume"에 만들었습니다.

mkdir prometheus
mkdir prometheus\config

cd prometheus
2. Docker Compose YAML 작성 (Prometheus + Grafana)
"작업폴더"에서 docker-compose.yaml 아래와 같이 작성
version: '3.7'  # 파일 규격 버전
services:
  prometheus:
    image: prom/prometheus
    container_name: prometheus
    volumes:
      - C:\workspace\Docker\volume\prometheus\config:/etc/prometheus
      - C:\workspace\Docker\volume\prometheus\volume:/prometheus
    ports:
      - 9090:9090                                              # 접근 포트 설정 (컨테이너 외부:컨테이너 내부)
    command:
      - '--web.enable-lifecycle'                               # web.enalbe-lifecycle은 api 재시작없이 설정파일들을 reload
      - '--config.file=/etc/prometheus/prometheus.yml'
    restart: always
#    networks:                                                 # 개별 네트워크 구성 필요 시 주석해제하여 사용하면 됨
#      - promnet

  grafana:
    image: grafana/grafana
    container_name: grafana
    ports:
      - "3000:3000"
    environment:
      - GF_SECURITY_ADMIN_USER=admin
      - GF_SECURITY_ADMIN_PASSWORD=admin
    restart: always
    depends_on:
      - prometheus
#    networks:
#      - promnet

#networks:
#  promnet:
#    driver: bridge
3. Prometheus 설정 파일 생성
설정 참고: https://prometheus.io/docs/prometheus/latest/configuration/configuration/
"작업폴더"/config폴더에 prometheus.yml을 만들어 아래와 같은 문구를 작성하여 생성합니다.
global:
  scrape_interval: 15s

scrape_configs:
  - job_name: 'prometheus'
    static_configs:
      - targets: ['host.docker.internal:9100']  # 필자는 커스터마이징하여 node-exporter를 만들었고, on windows에 exporter:9100으로 실행중입니다.
4. Custom node exporter 실행
사전에 만든 custom node exporter 실행
go run main.gogo-lang으로 node exporter 소스
package main

import (
	"fmt"
	"math/rand"
	"time"

	"github.com/gin-gonic/gin"
	"github.com/prometheus/client_golang/prometheus"
	"github.com/prometheus/client_golang/prometheus/promhttp"
)

func main() {
	// Gin 라우터 생성
	r := gin.Default()

	// Prometheus 레지스트리 생성
	prometheusRegistry := prometheus.NewRegistry()

	// Node Exporter 메트릭을 정의
	nodeExporterMetrics := prometheus.NewGaugeVec(
		prometheus.GaugeOpts{
			Name: "cpu_usage",
			Help: "An example metric for Node Exporter",
		},
		[]string{"server", "os"},
	)

	// 메트릭을 레지스트리에 등록
	prometheusRegistry.MustRegister(nodeExporterMetrics)

	// Gin 핸들러로 Prometheus 메트릭 엔드포인트 노출
	r.GET("/metrics", gin.WrapH(promhttp.HandlerFor(prometheusRegistry, promhttp.HandlerOpts{})))

	// 예제 메트릭 업데이트
	go func() {
		for {
			nodeExporterMetrics.WithLabelValues("server01", "windows").Inc()
			nodeExporterMetrics.WithLabelValues("server02", "linux").Dec()
			nodeExporterMetrics.WithLabelValues("server03", "osx").Set(rand.Float64())
			//nodeExporterMetrics.WithLabelValues("infraware002", "linux").Set(40)
			// 실제로 여기에서 시스템 및 하드웨어 메트릭을 수집하여 메트릭을 업데이트해야 합니다.
			// 여기에는 단순한 예제로 숫자를 설정했습니다.
			time.Sleep(1000 * time.Millisecond)
			fmt.Printf("--> metric set \n")
		}
	}()

	// 서버 시작
	fmt.Printf("--> run \n")
	if err := r.Run(":9100"); err != nil {
		panic(err)
	}
}
5. Docker 실행
도커 컴포트 실행시킨다.
docker compose up -d컨테이너를 중지하려면 다음 명령을 실행한다.
docker compose stop컨테이너를 다시 시작하려면 다음 명령을 실행한다.
docker compose start
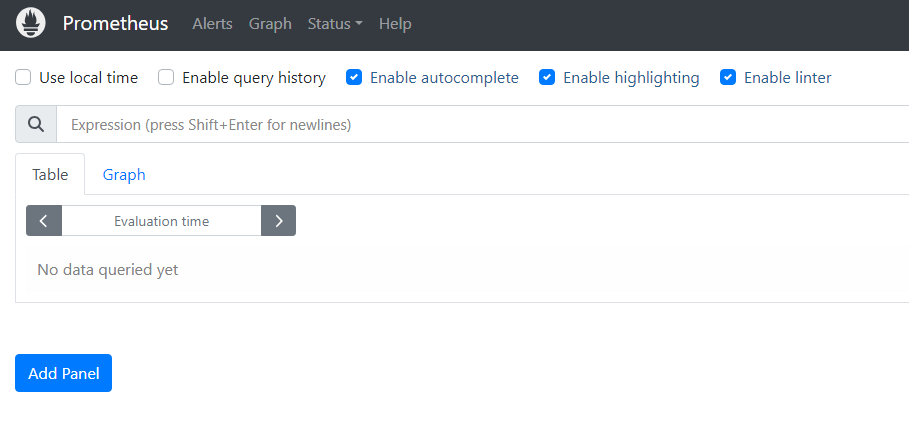
5. 접속 확인
- Prometheus
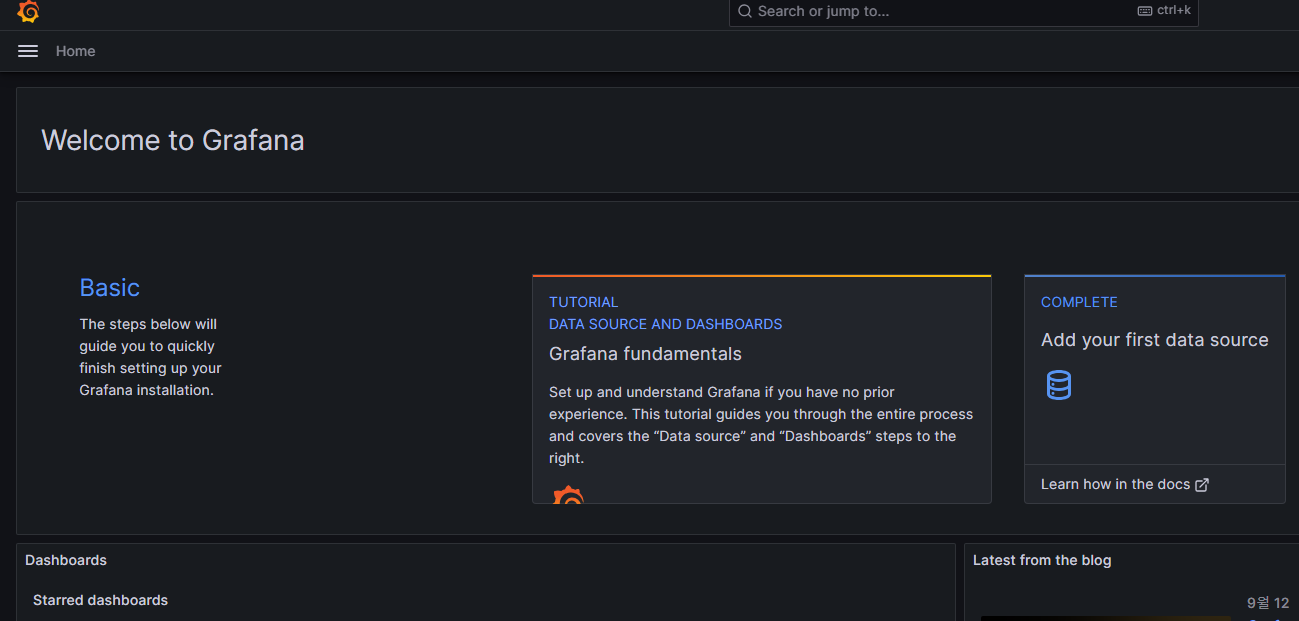
- Grafana
- http://localhost:3000
- admin / admin
* 위의 해당 소스를 보시려면 아래의 깃헙주소에서 소스 다운로드 하시면 됩니다.
https://github.com/nk915/prometheus_example
GitHub - nk915/prometheus_example
Contribute to nk915/prometheus_example development by creating an account on GitHub.
github.com
참조
https://www.devkuma.com/docs/prometheus/docker-compose-install/
'Cloud > Metric' 카테고리의 다른 글
| [Prometheus] node_exporter의 low data (0) | 2023.11.06 |
|---|